Here’s the thing:
Many new traders think they need more indicators to be a consistently profitable trader.
But the truth is…
It doesn’t work that way.
Imagine this:
The price is above the 20 period MA but RSI is showing the market is overbought.
At the same time, the ADX indicator is at 25 which shows a non-trending market.
So, which do you follow?
Now you’re stuck, right?
Well, the good news is…
Bollinger Bands can help you overcome this issue — and much more.
That’s why I’ve created this Bollinger Bands trading strategy guide to show you how useful this indicator is and what it can do for your trading.
You’ll learn:
- What is the Bollinger Band indicator and how does it work
- Bollinger Bands trading strategy: How to buy low and sell high
- How to use Bollinger Bands and “predict” when the market is ready to breakout…
- How to trade with the trend using Bollinger Bands
- The Bollinger Bands and RSI Combo (a little-known technique)
- The Rubber Band effect: How to use Bollinger Bands and “predict” market reversal
Or if you prefer, you can watch this training video below…
https://www.youtube.com/watch?v=KxlUFKPCxeg
Bollinger Bands explained: What is it and how does it work?
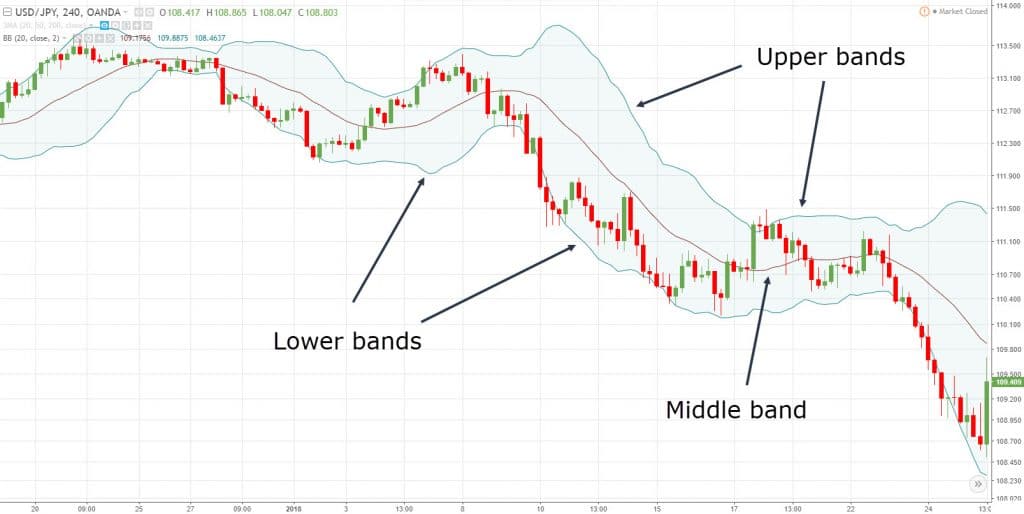
Bollinger Bands is a trading indicator (which consist of 3 lines) created by John Bollinger.
It can help you:
- Identify potential overbought/oversold areas
- Identify the volatility of the markets
Now you’re probably wondering:
“What do the 3 lines mean?”
Upper band – Middle band plus 2 standard deviation
Lower band – Middle band minus 2 standard deviation
Middle band – 20-period Moving Average
Note: I’ve used the default settings for Bollinger Bands which is 20-period moving average and 2 standard deviations for the upper and lower bands, which are commonly used for a Bollinger Band strategy.
So, what is standard deviation?
Well, it basically measures how far you’re away from the average.
If you want to learn more, go study this lesson on standard deviation.
So in other words…
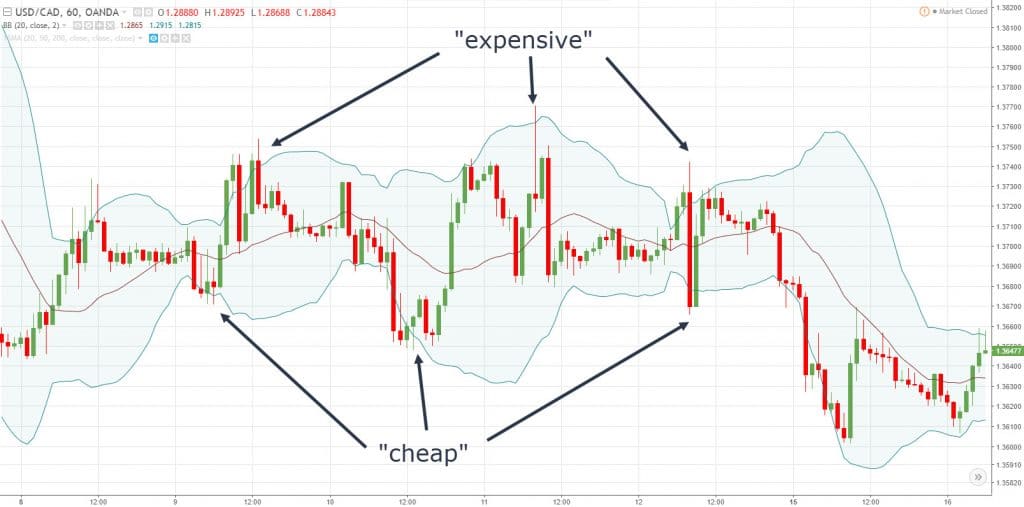
If the price is near the upper Bollinger Band, it’s considered “expensive” because it is 2 standard deviation above the average (the 20-period moving average).
And if the is price near the lower Bollinger Band, it’s considered “cheap” because it’s 2 standard deviation below the average.
Here’s an example:
Do not make this MISTAKE when trading Bollinger Bands
Now…
Just because the price seems “cheap” or “expensive” doesn’t mean you enter a trade immediately.
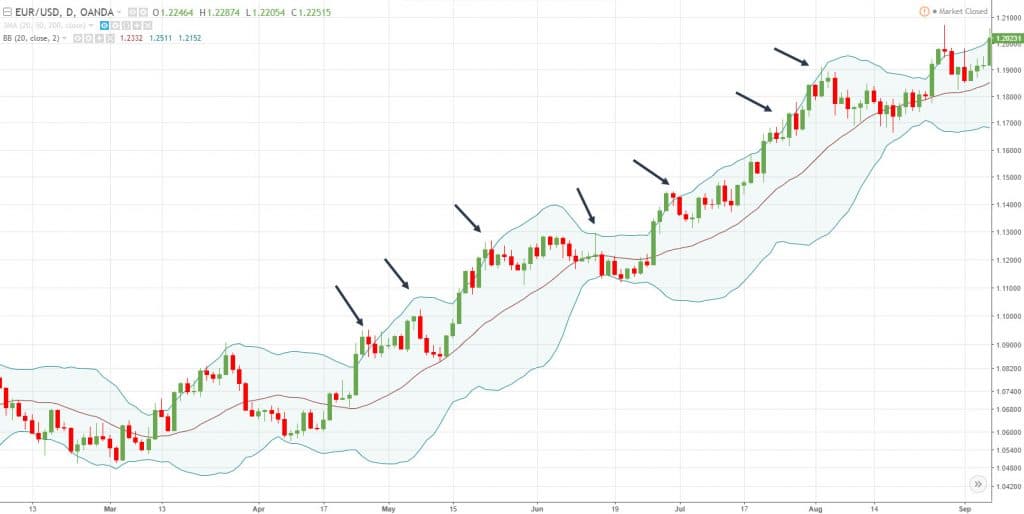
Because in trending markets, the market can remain “cheap” or “expensive” for a long period of time.
Here’s an example: EUR/USD remained “expensive” for many months…
As you can see, it’s a painful thing to do if you blindly short when the price is at the upper bands.
So what should you do?
Read on…
Bollinger Bands trading strategy: How to buy low and sell high
You’ve probably heard this a gazillion times.
If you want to make money in the markets, just buy low and sell high.
But the question is… HOW?
Well, you can do so with Bollinger Bands (duh).
Recall:
The outer Bollinger Bands are 2 standard deviations away from the mean.
This means if the price is in the lower band, it’s considered “cheap”. And if it’s in the upper band, it’s considered “expensive”.
But before you think…
“Great! I’ll just go long when the price reaches the lower band.”
Not so fast my young Padawan.
If you want to have a higher probability of success with the Bollinger Band strategy, then you’ll need a few confluence factors coming together before you trade the bands.
For example:
- Look to long the lower band in an uptrend (and vice versa)
- Reversal candlestick patterns that show signs of reversal
- The outer bands coincide with Support and Resistance
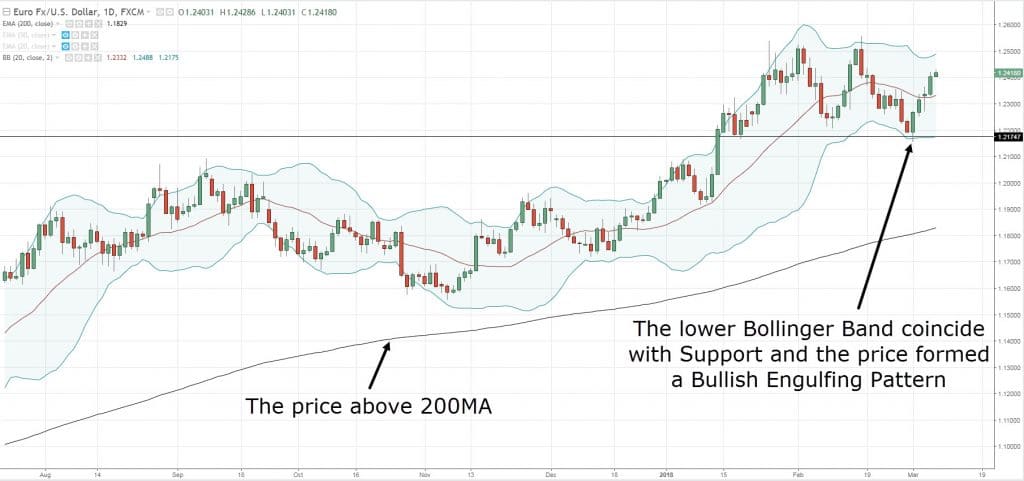
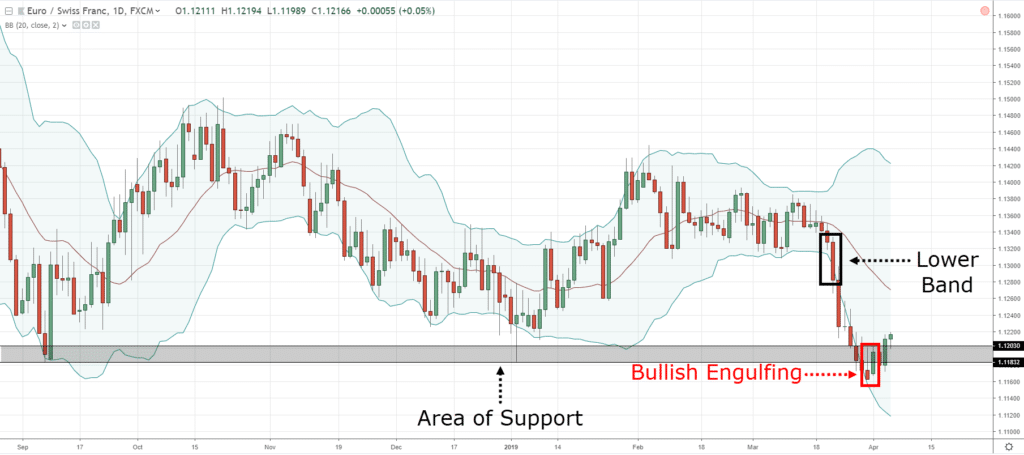
Here’s an example:
The price of EUR/USD is at the lower Bollinger Band that coincides with Support, and it formed Bullish Engulfing pattern.
Pro Tip: You can adjust your Bollinger Bands settings to 3 standard deviations (or higher) to identify even more overbought/oversold levels to trade-off. This can drastically improve your Bollinger Band strategy depending on the market condition.
Moving on…
Bollinger Bands Squeeze: How to identify explosive breakout trades about to occur
Here’s a fact:
Volatility is always changing.
The markets move from a period of high volatility to low volatility (and vice versa).
If you’re a new trader, it can be difficult to identify the volatility of the markets.
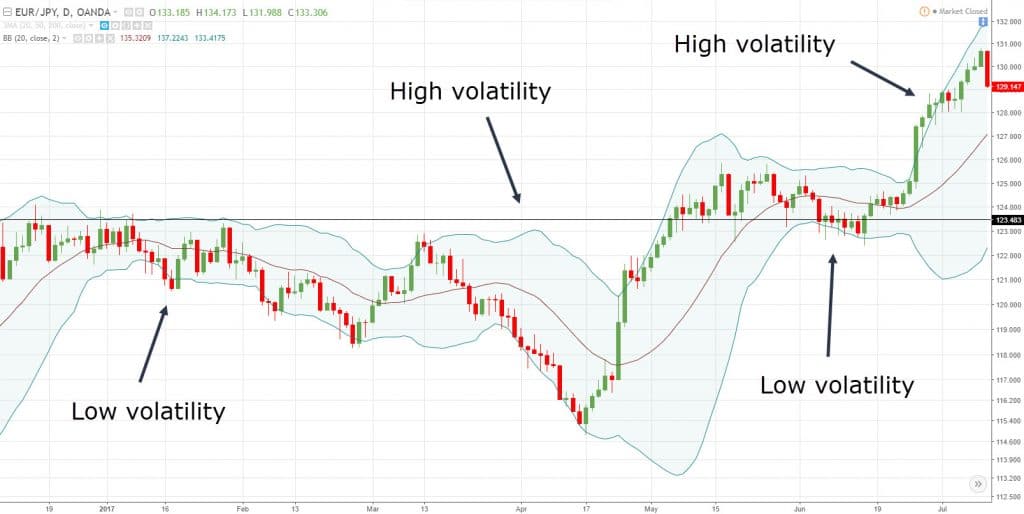
So, this is where a Bollinger Bands strategy can help because it contracts when volatility is low and expands when volatility is high.
Here’s an example:
So, the question is…
How do you use Bollinger Bands to anticipate a possible breakout?
Simple.
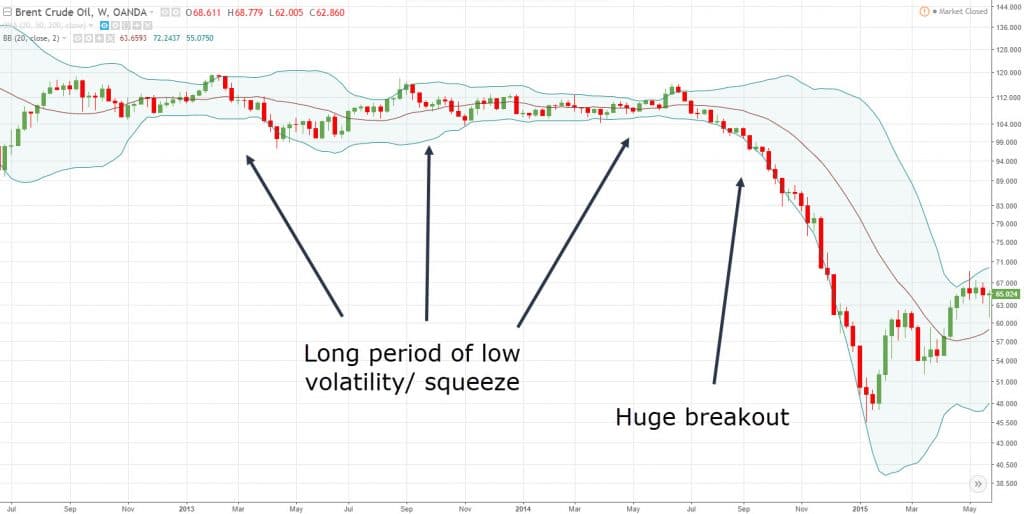
You look for the Bollinger Bands to contract (or squeeze) because it tells you the market is in a low volatility environment.
Why?
Because volatility tends to expand after contraction!
An example: Before the breakdown, Crude Oil is in a low volatility environment (as shown by the contraction of the bands).
Pro Tip: The longer the volatility contraction, the stronger the subsequent breakout will be.
How to identify the direction of the breakout
Now…
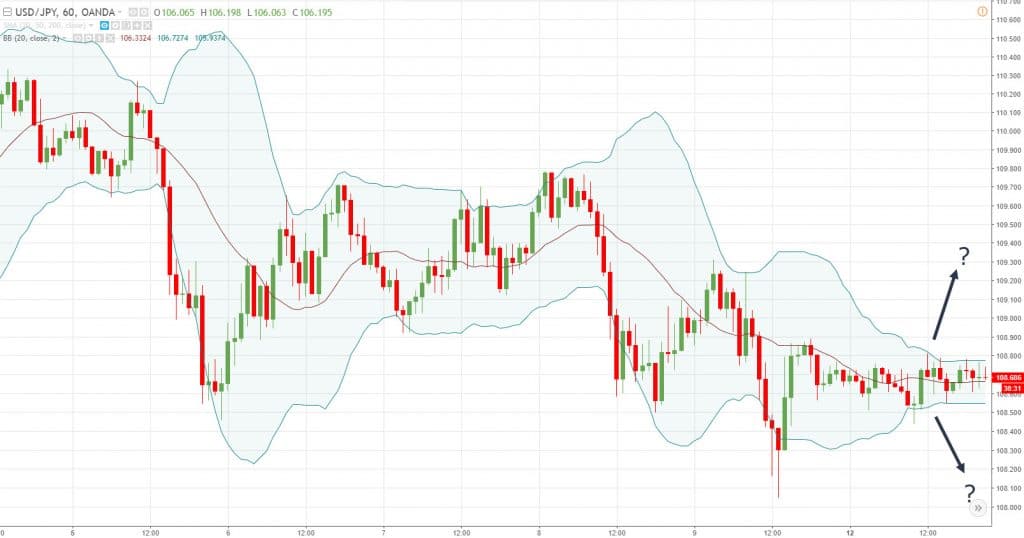
Although Bollinger Bands can alert you to potential breakout trades, it doesn’t tell you the direction of the breakout.
However, you don’t need to be Einstein to figure out where the market is likely to go.
Because all you need to do is look at the trend.
Look at the chart below:
Where do you think the market is likely to breakout, higher or lower?
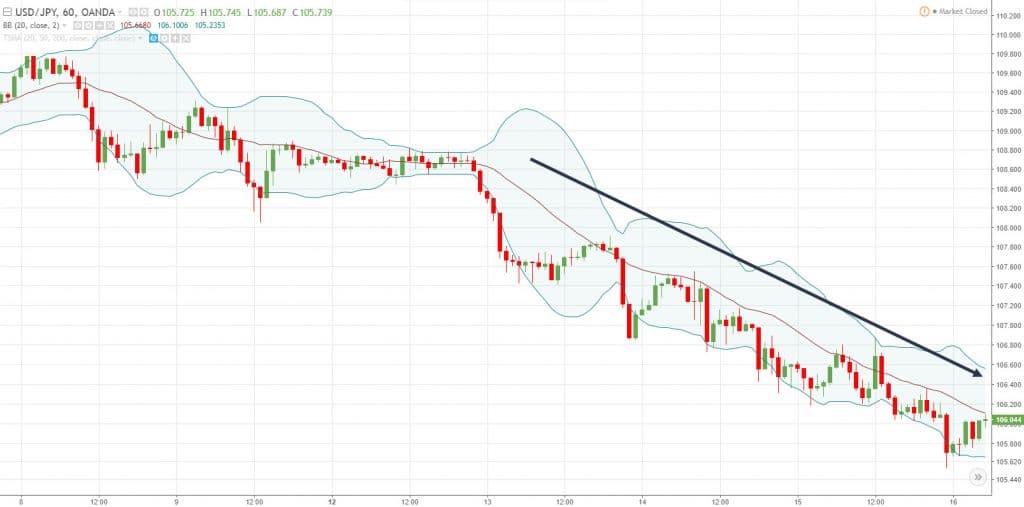
Probably lower because the trend is down.
And you’re right because the market broke down lower (yes I cherry-picked this chart)…
Simple yet powerful, right?
How to trade with the trend using Bollinger bands
Here’s the deal:
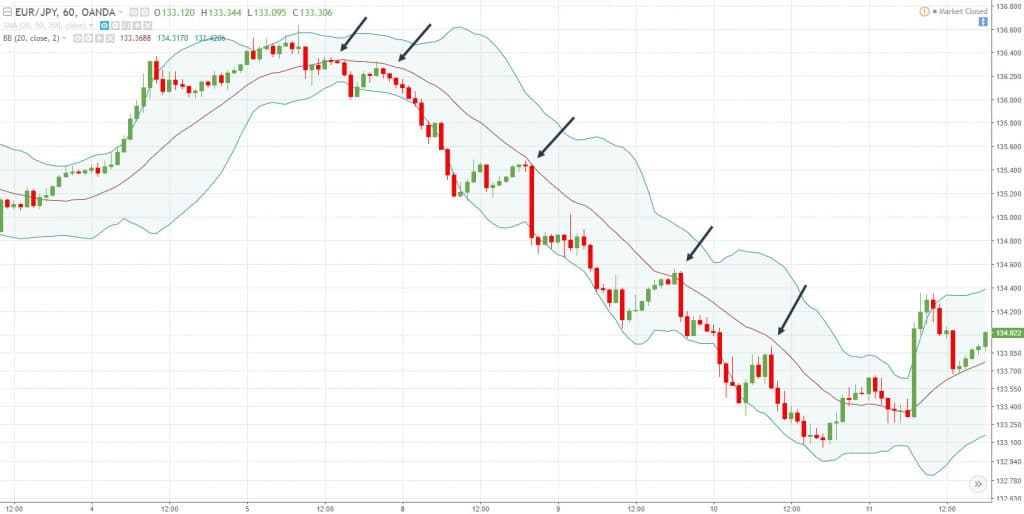
You know the middle line of the Bollinger Bands is simply a 20-period moving average (otherwise known as the mean of the Bollinger Bands).
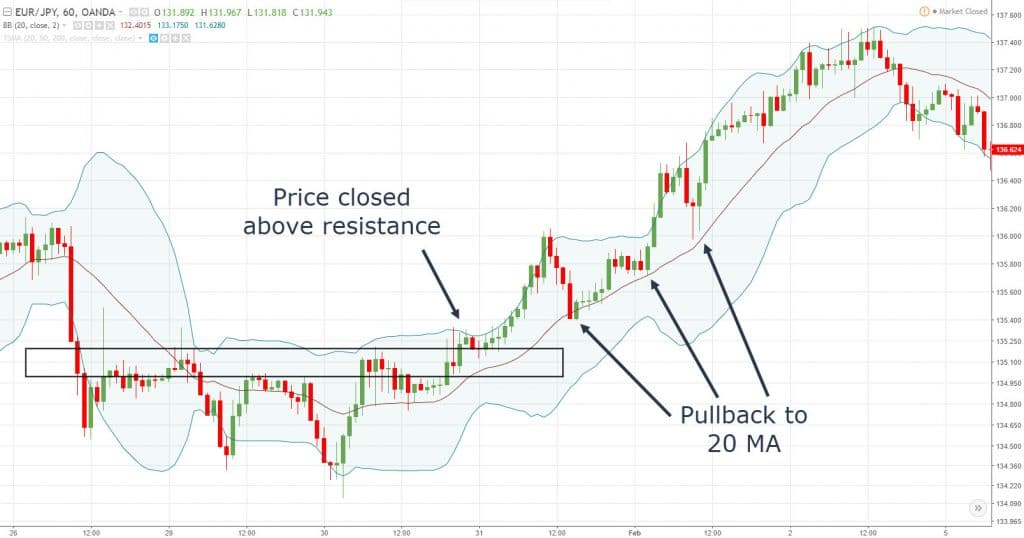
And in strong trending markets, the 20-period moving average can act as an “area of value”.
This means when the market pullback towards the 20 MA, it’s an opportunity for you to get long (or short).
An example: The price bouncing off the 20-period moving average and it offers shorting opportunities…
Here’s another example:
Pro Tip: If you want to ride the trend, you can trail your stop-loss using the 20 MA, or the outer Bollinger Bands.
The Bollinger Bands and RSI Combo (a little-known technique)
Here’s the thing:
The Bollinger Bands indicator is great for identifying areas of value on your chart.
But the problem is… it doesn’t tell you the strength or weakness behind the move.
For example: How do you tell if the market will continue to trade outside of the outer bands or mean revert?
That’s where the Relative Strength Index (RSI) indicator comes into play.
And what you’re looking for is a divergence on the RSI indicator.
You’re probably wondering:
“What is an RSI divergence?”
Well, it can go 2 ways…
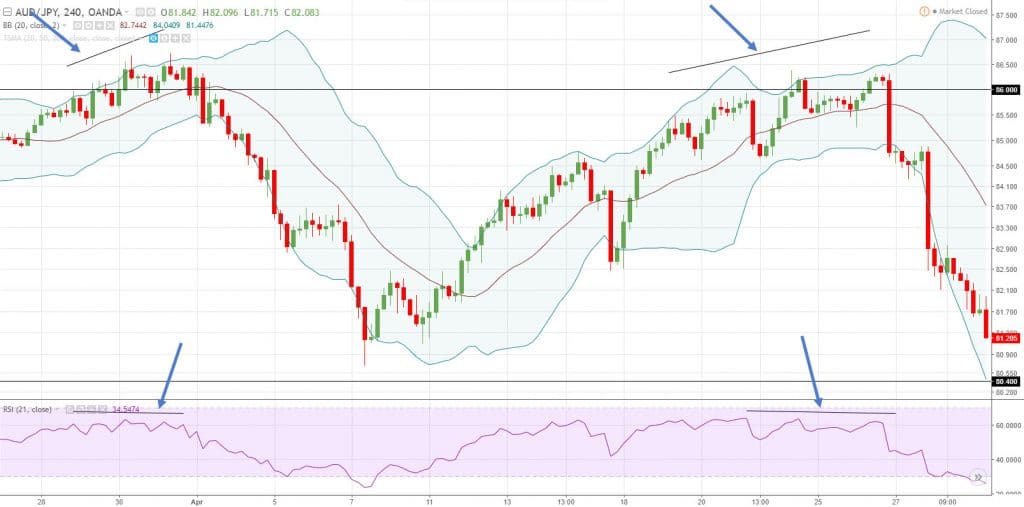
- A bearish divergence is when the market makes a higher high, but the RSI indicator shows a lower high (a sign of weakness)
- A bullish divergence means is when the market makes a lower low, but the RSI indicator shows a higher low (a sign of strength)
So, now the question is…
“How do you combine RSI divergence with Bollinger Bands?”
Here’s how:
If the price is at upper Bollinger Bands, then you can look for a bearish RSI divergence to indicate weakness in the underlying move.
Or…
If the price is at lower Bollinger Bands, then you can look for bullish RSI divergence to indicate strength in the underlying move.
Here’s an example:
Pro Tip: You can combine this technique with Support and Resistance to find high probability reversal trades and improve your Bollinger Bands strategy.
The Rubber Band effect: How to use Bollinger Bands and “predict” market reversal
Now:
You can think of Bollinger Bands like a rubber band.
Whenever the price gets too far away from it, it tends to mean revert back towards the middle band.
You’re probably thinking…
“But how do you know when it’s about to snap back? Because the price can stay overstretched for a long time.”
You’re absolutely right.
That’s why you must also take into consideration Bollinger Bands, Support Resistance, and Candlestick patterns.
Here’s how it works…
(For long setups)
- Look for strong momentum into Support
- You want to see the candle close outside the lower Bollinger Bands (this tells you the market is overstretched)
- If the next candle is a bullish reversal pattern (like Hammer, Bullish Engulfing, etc.), then the market is likely to reverse higher
- And vice versa for short setups
Here’s what I mean…
Price bounced from Support at EUR/CHF Daily:
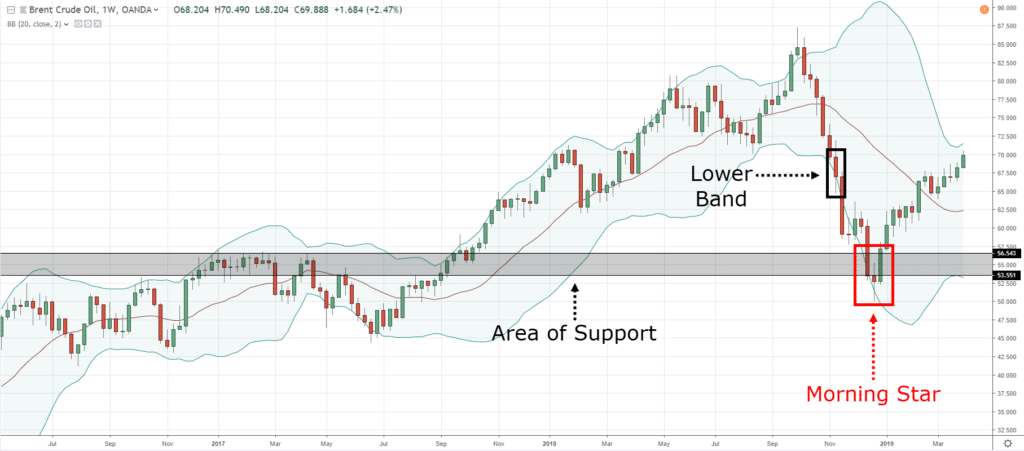
Price bounced from Support at Brent Crude Oil Weekly:
Pro Tip:
By default, the outer bands are 2 standard deviations away from the middle band (20MA).
If you want to identify even more overstretch market conditions, you can increase the standard deviation to 3 or more.
Frequently asked questions
#1: Hey Rayner, what timeframe does the Bollinger Bands work best on?
There’s really no best timeframe out there to use the Bollinger Bands as the concepts I’ve shared can be applied across different timeframes.
So it depends on your trading style and approach:
- If you’re a day trader, then you’ll use the Bollinger Bands on the lower timeframe like the 15-minutes or 5-minutes timeframe.
- If you’re a swing or position trader, then you’ll use the Bollinger Bands on the daily or the weekly timeframe.
#2: Is there any difference between the accumulation stage of a market and a Bollinger Bands squeeze?
Yes, there are differences. An accumulation stage is a range market within a downtrend, where you can identify resistance and support as price swings up and down within the accumulation.
Whereas in a Bollinger Bands squeeze, the market doesn’t swing up and down because the price action gets really tight and the candles are overlapping one another. So it’s impossible to identify support and resistance in a Bollinger Bands squeeze.
#3: Is it better to use Bollinger Bands to trade breakout or to trade market reversals?
It can similarly serve for both breakout and reversal trades.
You can look to trade breakouts after a Bollinger Bands squeeze.
Or you can also use it to trade market reversals after the Bollinger Bands expand, which shows the increase in volatility of the market. If the price comes to a key market structure like support resistance and then forms a price rejection, that’s a possible opportunity for you to take a reversal trade.
Conclusion
Here’s what you’ve learned today:
- The Bollinger Bands indicator can help you identify when the market is “cheap” or “expensive”
- In an uptrend, you can long near the lower Bollinger Band
- In a downtrend, you can short near the upper Bollinger Band
- When the Bollinger Bands is in a squeeze, it signals the market is “ready” to breakout
- You can use the 20-period moving average to time your entries in trending market
- You can use Bollinger Bands and RSI divergence to find high probability reversal trades
- You can use Bollinger Bands and Support and Resistance to “predict” market reversal
Now, here’s what I would like to know…
How do you use the Bollinger Bands trading indicator?
Let me know your thoughts in the comments section below.


Thank you Rayner, excellent post very useful
Awesome to hear that!
Great article… i would like you write about equity curves and analisyng when your strategy has stopped working or on a drawdown… i believe is an interesting subject and almost nobody talks about it.. gracias desde Mexico
I wrote an article about it here… https://www.tradingwithrayner.com/trading-strategy-stopped-working/
Thnks so much you such a blessing to us my the heavenly father keep blessing you more nd more
Rayner, i think u should do 1 on utube soon on bolingger band .. coz it gonna been helpful to the people that follow u on utube like me and the rest .. thank you in advance …. see u there !!! Hihihi.
I’ll look into it, cheers.
Thank you for your labor of love. Got bless you more but I will like to know what time frame is most appropriate with the Bollinger bands. Thank you
I always focus on 4hr and daily Time frame bcos I’m an intraday trader.
Thanks for the tutorial on Bollinger Bands. I’ve never used this indicator before and after following Mr Bollinger on twitter for a while now, I’m more interested to consider his indicator in my charts.
Sure thing. Let me know how it works out for you buddy.
May I know where I can read more about B.B. and RSi strategy for reversal ?
I don’t have anything in more details yet…
Please Read The book Bollinger on Bollinger bands.
Mr Rayner! Great ! Grateful are we to you!!Nice strategy! Kindly mention the parameters &
levels of the RSI.As always ,the traders wille ever grateful to you.
I used the default 14-period in this example.
Thanks Ray, this has been an eye opener. I find it easy using my phone than my laptop, problem is, on my phone there’s only the middle moving average and don’t know how to set up the outside ones. Please help.
You should contact your platform provider.
Thank you for sharing this article. This my first time to learn something about bollinger bands and RSI ?
I hope you got something out of it 🙂
Hey Rayner,
I have been learning from your post and videos. Your post and videos have turned a novice trader into a more skillful one. Thank you. I am grateful.
I’m happy to hear that.
Rayner, thanks for all your tips.
In this last example with RSI, it is not clear to me that when the price is at the upper band that the RSI is having lower lows suggesting bearish divergence.
You can look up for bullish and bearish divergence on google and find more examples.
Very Useful insights U flash.. Thanx Bro…
cheers
hi rayner , when i see the price at the top or bottom i look at the shape of the band .
if its curving inward on both sides i don t trade , if it ‘s opening up wide on both side
i will take a trade depending on which band the price is at
. anyway thank you so much for the lesson here ,
especially about the RSI divergence
cheers ! you are doing a great job .
Hey Anton
Great tip!
When the outer bands are curved, it usually signals a strong trend.
When it’s flat, it’s usually in a range.
I miss words to express my gratitude to Mr. Teo Rayner for his willingness and his availability to keep us company in this adventure for success. Thank you again for this very sacred and useful trading training
Glad to be of help!
Excellent! I hope to use this in my trading
Let me know how it works out for you.
Thanks Rayner. Good stuff, easy to understand and to apply. Straightforward.
Awesome to hear that!
Have been using BB for some time but not in conjunction with the RSI, thanks for the tip.
Always look forward to your weekly sessions.
Cheers
My pleasure!
Great session Rayner, I think Combining BB with RSI is the best part here.
Glad to hear that!
Sir can you elaborate RSI divergence cant understand well….
Very thankful to you…
How do you combine RSI divergence with Bollinger Bands?”
Here’s how:
If the price is at upper Bollinger Bands, then you can look for a bearish RSI divergence to indicate weakness in the underlying move.
Or…
If the price is at lower Bollinger Bands, then you can look for bullish RSI divergence to indicate strength in the underlying move.
Hey Mani
I’ve not written anything about divergence yet. You can google in the meantime for more information on that topic…
What window are using? The daily or hourly etch for this strategy?
The concept can work on different timeframes.
well done Rayner …great description
I dont use indicators at all…just price action support / resistance
But strictly speaking without using stop loss and risk reward…TRADERS WILL ALWAYS LOOSE AND BLOW THEIR ACCOUNTS AND CONFIDENCE EVENTUALLY.
I will give the bollinger band a try with the RSI
Many thanks again
Welcome bud!
Great article and very informative, I admire your selflessness and willingness to make others succeed in this biz world. Gratias
Cheers
Hi Teo,
I will try this strategy with MACD divergence. Thanks
Sure thing!
Hey buddy, long time your subscriber, like many others, had read a lot of your posts, books, webinars, videos, indicators, lectures, mentors, etc. etc. In practice, nothing for sure works every time. Now personally I am tired of all this. I suggest you start as signal provider and charge for subscription. At the end of day I make money so do you. Life is short.
Hey Waheed
If this isn’t for you, I suggest you unsubscribe as I don’t want to waste your time further.
Best!
Thanks Rayner. I was much against using indicators, but this is really useful and explained lucidly.
Glad to be of help!
I have yet to come across a lesson taught by you that wasn’t informative. Very insightful. One of my favorite forex traders to follow. Thanks for your hard work and dedication.
Thank you for your kind words, Kevin!
thank u for this combination of BB and RSI
it is really helpful
looking forward for another outstanding blog from you
You’re welcome!
Hi Rayner,
I have used the strategy you described in the past with a fair amount of success…but ‘neglected’ it as I ‘moved’ on to other strategies. Thanks for reminding of this very good strategy which can be very profitable with practice…
Thank you for sharing, Johann.
Funny, I was just looking at trying some BB trading this week.
Lookup the Fiji bb alert indicator. May help.
Thanks Rayner
Welcome!
wow wow wow, i have not seen, watch or read any thing as clear and precise as your materials. you are a blessing to our generation.
my eyes and mind is as open as the day lightl
am a better trader now in just 1week, by studing your materials.
thanks Rayner
I appreciate your kind words!
Hey Rayner! You always surprised me with your articles, thanks for everything.
You’re welcome!
Hi sir Rayner,
Aside combining RSI on BB, do you also combine Average Directional Index (ADX)? In addition, what time-frame does BB effective?
Thank you.
You can trade the concept on any timeframe as long as there’s sufficient liquidity.
Hy Ryno
As a beginner I’ve really learned so much from your video’s and Posts. My question is for example can we print this article it’s easier for me to follow ?
Sure thing but please do not sell them.
sir,very well pls send me this guid
I don’t have a pdf guide for this.
Brilliant Rayner!
At first, I thought I would not be able to understand this BB, their I was not interested. But the way you have explained here is really as clear mud!
Many thanks, much appreciated.
All the best,
Adrian
I’m glad to hear that, Adrian!
Hi Rayner,
It can’t get any simpler. Gr8 work buddy
Cheers
Cheers Santosh
As a beginner, this was very clear and helpful. I stumbled on your post as i was trying to understand more about BB. I will look for more of you materials and hope they are as insightful. Thanks for sharing.
You’re welcome!
Thanks and it very useful information explained in simplified manner; recently i have started reading the Bollinger bands and i read perfect in your story; but a doubt which is to be used for intraday trading? 20 or 10 ma? Is there any difference in ema/sma?
Thanks and expecting more simplified explanations
The difference is that EMA is more responsive compared to SMA.
Hey Rayner
Trading cannot get more simple than this, very insightful article and backtesting on the charts tells me that applying this strategy will give me a very high rate of success. A stop loss may not even be necessary most of the time, but where do u suggest i place the stop loss in case momentum shifts against me?
Thanks once more
There are many ways you can set your stop loss, for example, you can can set your stop loss X ATR away from your entry.
Rayner I really need your help. I’ve traded many years day trading the NQ. I usually only have a small account.I always lose the account and because I don’t want to lose a trade my stops are too large. I want to ( someday) trade as you do ,in the middle to long term ,but don’t have the monies for that. Do you think that I should continue with the NQ ,but to tighten my stops ? I use a 2 min and 5 min chart ,sometimes a 10 min. I’d love to hear what you think. Thanks, Dave 413-566-8170
Hi Dave
You can consider trading other products like Forex.
Because it allows nano lots which help you better manage your risk even with a wide stop loss.
I just started my journey in trading few months ago. This is the first time I learned about Bollinger Bands and how useful it can be paired with RSI. I am still practicing all the concepts I know about charting. I somehow check all possible setup that can work with me. Thanks for this article.
You’re welcome!
This is indeed a great tutorial, very helpful! God bless the writer beyond bounce. Zillion thanks Boss.
My pleasure!
Rayner,
What is do is this –
I enter long on the first candle above the middle Bollinger (RSI has to be above 50 @ this stage and rising).
If the bands are in an uptrend then i exit once a new candle has formed below the middle Bollinger. (RSI falls below 50 usually at this stage)
If the bands are sideways i place my take profit a few points below the upper band.
My initial stop loss is just below the last candle that formed below the middle bollinger. Trail stop at last consolidation thereafter.
My entry and exit is based on the middle band always. This way i found trades ride profits better.
I use the 1 hour chart for trading and 4 hrs for trend confirmation. I only trade in the direction of the 4 hrs.
Trades are few this way but i find that this is safe and so i trade thus.
You are the reason my trading turned around so thank you for being so generous.
Take care and keep inspiring others. Thank you
Thank you for sharing, awesome to hear that!
What is 2 standard deviation?
Google it.
Thanks for your kindness.
Great Larson
Cheers
Thank you. Clear explaination with example pictures
You’re welcome, Che!
Another Excellent stuff from you Rayner.Can you please tell how to trade with double bollinger bands?Or make a video?Thanks.
I’ll look into it cheers.
Massive thanks to you Rayner,
Keep the good work that you are doing for us up your rewards are wait.
You are one in a million Rayner I really like and love you.
I appreciate the kind words, Desola!
HEY HEY my friend you are really doing a good inspirational work buddy. God bless. You are simply awesome 🙂
Thank you, Yash!
Nice strategy on the bollinger bands….wasnt aware of the cheap and expensive bands….would work perfect on my digital $ binary options trading.. Love your trading guide on TREND DETERMINATION
Its more PRO keep it up man
Cheers Astra!
Thank you for clearly explaination.
My pleasure!
superb!! Thank you sir!!
You’re welcome!
Wonderful explanation of Bollinger Bands, very useful article on how to use these bands for trading opportunities. Thank you very much, Sir
My pleasure!
In another article you said that after accumulation market will moves to advance/ up ward direction ( whereas accumulation occured after the decline the market).
Whereas in this article you said when BB is squeezed / tight then breakout is heppened in the direction of trend ( Some times BB is squeezed after the decline / advance market).
Is is not contradictory to each other please clarify thats.
An accumulation stage is longer term in nature that looks like a range market in a downtrend, you can spot the Support and Resistance in an accumulation stage.
A Bollinger band squeeze is like a “tight sausage” where you won’t be able to identify the SR in it and it doesn’t stay “tight” for a very long period of time unlike an accumulation stage (which can last 5 months or more).
Thnx bro i watched alot of youtube videos but yours are the best for me ur helping me bro thnk you very much
Glad to be of help!
hi im a new comer,,can i use it for binary trading option
? thanks for your reply
I can’t comment on it as I don’t trade binary.
i am now going to profitably use Bollinger Bands after reading your educative piece on the Bollinger Bands.
All the best, let me know how it works out for you. cheers.
A very good sharing
Cheers
Very quick and easy way to understand how to use Bollinger Band for trading…..
greate job bro, funtastic post
Thanks bud!
This lecture was absolutely awesome,l greatly appreciate your labour in shedding more light.
I was using volatility bands but without this unique knowledge and usually l was about to fade out.
Thank you very much.
My last question is can l use this volatility strategy to trade volatility index 75
Hey Michael, glad to hear it helps.
I’ve not heard of the volatility index 75 so I can’t comment on it.
Excellent Ryan..very clearly explained!!
Cheers Sachin
Extremely useful, thank-you!! I enjoy learning from your books and videos!! The books are very easy to read and understand!! The same with or videos!!
Awesome to hear that!
Thanks Rayner sir ,I am very excited to learn your price action guide .please send a PDF of strategy of intraday market. Thanks
Good explanation with a lot of examples. very clear and easy to understand. Thank you!
My pleasure!
Thank you Sir, excellent post very useful
You’re welcome!
Excellent,
Weldone thanks
Cheers
Very helpful, I used BB earlier, couldn’t get benefit out of it but I think you describe it well enough and I understand where was the lack.
Cheers
fantastic material which is guiding the traders in the right and profitable way! Iam extremely happy. Thank you, sir.
Cheers
These Identify potential of overbought/oversold areas then also
Identify the volatility of the markets
Thank you so much Sir for very useful info.
My pleasure!
You’re the best Rayner may god bless you
Hi Gokul,
You are most welcome!
Thank you Rayner, I’ve been testing the Bollinger the all week, and for a Day trader, it is helpful! Have a great week-end
Hi Alphonse,
I’m glad to hear that!
I just lost 6usd on eurgbp which wouldn’t have happened if I came across this tutorial 5minutes earlier .
Rayner is a blessing to this generation
Hi Ebuka,
You are most welcome!
Cheers.
thank you rayner for this topic . and I have A question if you don’t mind .
I notice some use it with combination with Keltner channel with a setting length 16 and factor 1.16 so dose it make any benefit ?
and my second question using 50MA instead of 20MA for the middles of BB .
thanks again
Hi Hulail.
Keltner Channel uses Average True Range and Bollinger Bands uses Standard Deviation.
And if you compare the two, you’ll realize Keltner Channel is “smoother” compared to Bollinger Bands.
Check this post out…
https://www.tradingwithrayner.com/keltner-channel-indicator/
Very good
Hi Santosh,
Thank you!
Thanks Rayner, for such type of premium contents you provided free of cost on You Tube and your website. No one gives such type of contents even if in their paid programs. I am a beginner and assure you, I will master this strategy.
God bless you.
Hi Anil,
It’s my pleasure!
You are teach us great knowledge in simple way
Hi Prem,
I’m glad to hear that!
It’s my pleasure…
Thank you very much Mr Reyna I have learnt a lot , but please are are your books for sale if so how much?
Hi Raphael,
Check out the website.
https://www.tradingwithrayner.com
https://pullbackstocktradingsystem.com/
https://priceactiontradingsecrets.com/
Good job.
Thank you. John!
Great Rayner. Appriciated . Thanks
Hi Edison,
You are most welcome!
Cheers.
I have learned another improved way of using the Bollinger Band indicator. I will include the RSI to it for better confirmation.
What I do before is confirm the candle polarity change for a buy or sell at the upper and lower bands respectively. It has been about 70% efficient but I have always had a reservation that it can work better. I am glad I read this strategy from you and I hope to put it to practice.
You are the real deal in FOREX, Rayner!
Hi Omo,
I’m glad to hear that!
Cheers.
I prefer use Bollinger Bands and RSI divergence to find high probability reversal trades. I’m still not understand how RSI work as indicator for entries or exit.
Hi, recently the dollar index broke down the lower bollinger band and went down even much more and did not bounce back for quite a while(2-3weeks). So it was very frustrating if long hoping for reversal. How can it stay outside of the band for so long?
And the RSI for divergence, which is a reasonably accurate one,i.e 5,7,14days?
Thank you sir
You are welcome. Akshay!
rayner thanks for you you’ve been doing you really open my eyes to a lot of thin in this business I really appreciate may God bless you more
You are welcome, Ayomide!
am still learning from you , I appreciate
Awesome, Bright!
Excellent information, learning a lot. Thank u Rayner
You are most welcome, Hari!
It was a wonderful lesson. please can you send me names of Brokers, that allows NANO LOT SIZE, let us say 300 units. thanks.
Hey Lily,
Please write to support@tradingwithrayner.com
Cheers.
Thank you Rayner for this awesome article!
One question:
What’s the difference between the rubber band effect and the “buy low and sell high”?
Aren’t the two about going long when price reaches the lower band and short when it reaches the upper band, in confluence with a resistance or a support and a reversal candlestick?
Thank you Rayner sir , ur teaching very Beautifully, I can understand everything easily, , thanks a lot , , , ,
You’re most welcome, Raghad!
Hi Ryner! This is how I use the Bollinger bands indicator. Bollinger bands with stochastic oscillator, trend line and support and resistance, in combination of reversal candlestick patterns in a trending market. If both BB and SO, indicates oversold at the same time previous resistance turns support at the trend line.
With this strategy, I want to satisfy 3 conditions before I open a position.
1. Previous resistance turns support/ previous support turns resistance at a trend line
2. a strong price rejection
3. Bollinger bands/stochastic oscillator oversold/overbought.
I’ve been winnin more trades than I lose for the past two weeks with this strategy.
Thank you Ryner! I build it by adding the two indicators to a strategy you thaught earlier in one of your lessons. You are the man!
Thank you for sharing, Mohammed!
Thanks a lot Rayner, this has really opened my eyes…..From Nigeria
No worries, Paddy!
Rayner is happy to help!
Cheers.
Excellent & mind blowing analysis. I think it will be highly beneficial for all who will obey pros and cons of rules of the bollinger band strategy.
Thanks, Yudhisthira!
I have been further enlightened regarding Bollinger bands. Tbank you.
Glad to know that, Ephraim!