The Inside Bar is a simple but powerful candlestick pattern.
It can help you better time your entries with low risk.
The best part?
You can use it to trade with the trend or, market reversals.
Heck yeah!
But first…
What is an Inside Bar and how does it work?
An Inside Bar is a candle that’s “covered” by the prior candle.
Here’s what I mean…
Now when you see an Inside Bar candle, it means there’s reduced volatility in the markets.
However, not all Inside Bars are created equal.
Here’s why…
1. Inside Bar with a small range
This is a standard Inside Bar candle where the range of the candle is small, and it’s “covered” by the prior candle.
This tells you there are indecision and low volatility in the markets.
An example:
(Note: This will be the focus of our article)
2. Inside Bar with a large range
You can also have an Inside Bar candle with a large range.
This is still an Inside Bar as the range of the candles is “covered” by the prior candle.
But, you’ll notice the range of the Inside Bar is large too.
Now, depending on the close of the Inside Bar, this could represent indecision or a reversal in the markets.
Here’s what I mean…
Large Inside Bar with bullish close showing signs of strength:
Large Inside Bar with a small body showing signs of indecision:
3. Multiple Inside Bars
And finally, you can have multiple Inside Bars together.
This is a powerful pattern because it tells you there’s low volatility in the markets.
And volatility in the markets are always changing, it moves from a period of low volatility to high volatility (and vice versa).
So, when you see multiple Inside Bars together, it’s a strong sign the market is about to make a big move soon.
Here’s how it looks like…
Moving on…
Don’t make this common mistake when trading the Inside Bar…
Now:
Many traders would spot an Inside Bar and they’ll trade the breakout of it.
That’s not smart because it’s a low probability trade especially when the market is in a “choppy” range.
So, how should you trade an Inside Bar?
Well, that’s what you’ll discover next.
Read on…
Inside Bar trading strategy — Catch the reversal
Here’s the thing:
Many traders love to trade Inside Bars at market structure (like Support and Resistance).
For example:
The price approach Resistance and it forms an Inside Bar.
Then, traders would look to go short on the break of the Inside Bar.
Personally, I don’t like this approach because it’s prone to a fake out.
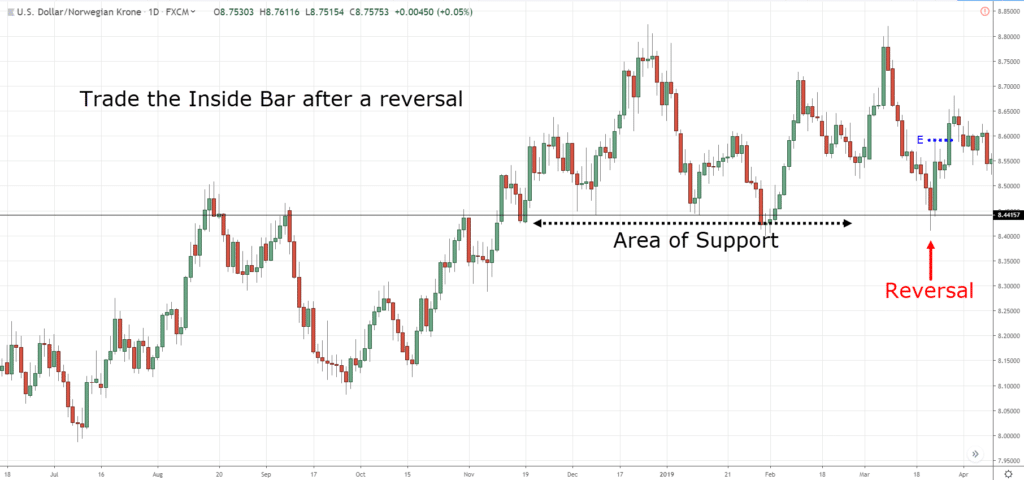
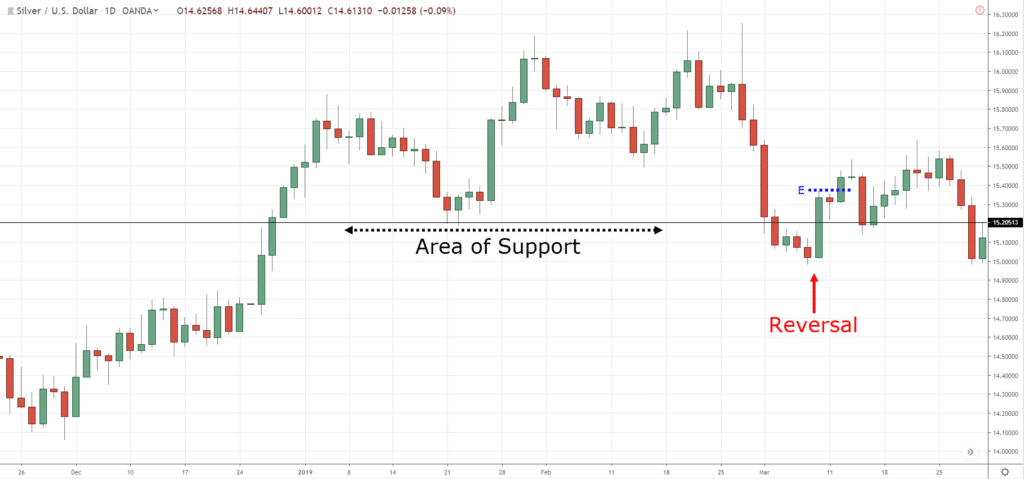
Instead, for my Inside Bar strategy, I prefer for the price to make the reversal move first and then form an Inside Bar.
This tells me two things…
- The buyers are in control as they managed to make the “first wave” of the reversal
- There’s a volatility contraction now and the buying pressure could continue if the price breaks out higher
Here are a couple of examples…
USD/NOK Daily: The price forms an Inside Bar after making a push higher
Silver Daily: The price forms an Inside Bar after making a push higher
Now you’re probably wondering:
“So where do I enter and exit the trade?”
Well, we’ll cover that later.
But for now, I want to share with you another powerful Inside Bar trading strategy…
Inside Bar trading strategy — Catch the trend
Previously, you’ve learned how Inside Bar allows you to catch reversals in the market.
Now, you’ll learn how to use the Inside Bar strategy to catch the trend.
Here’s the idea behind it…
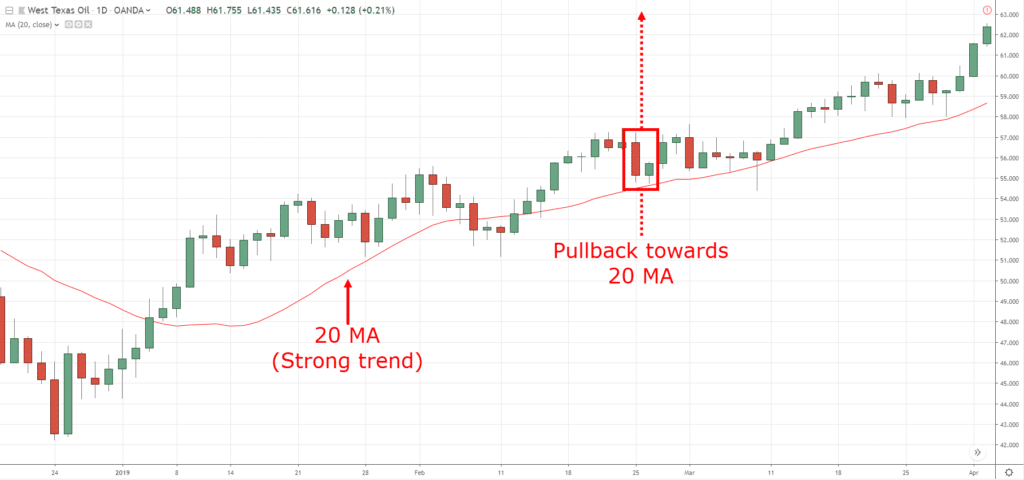
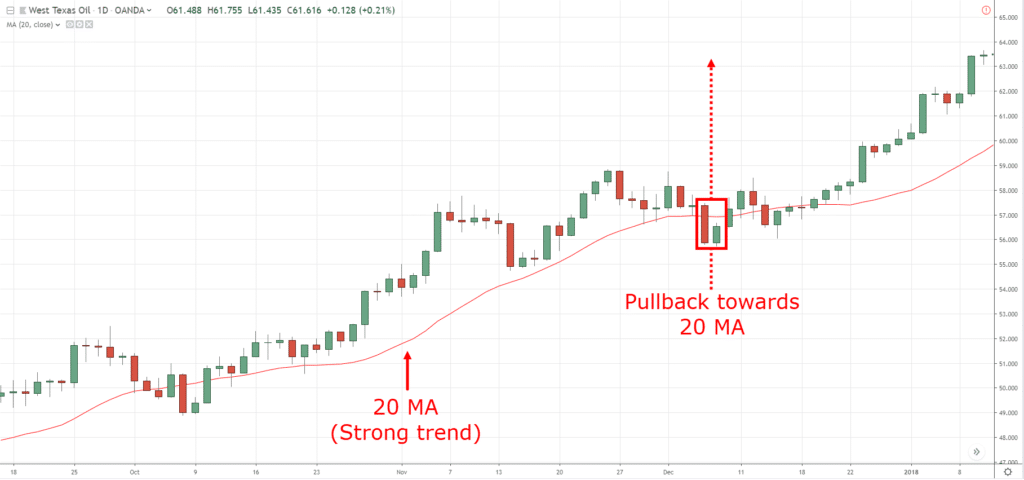
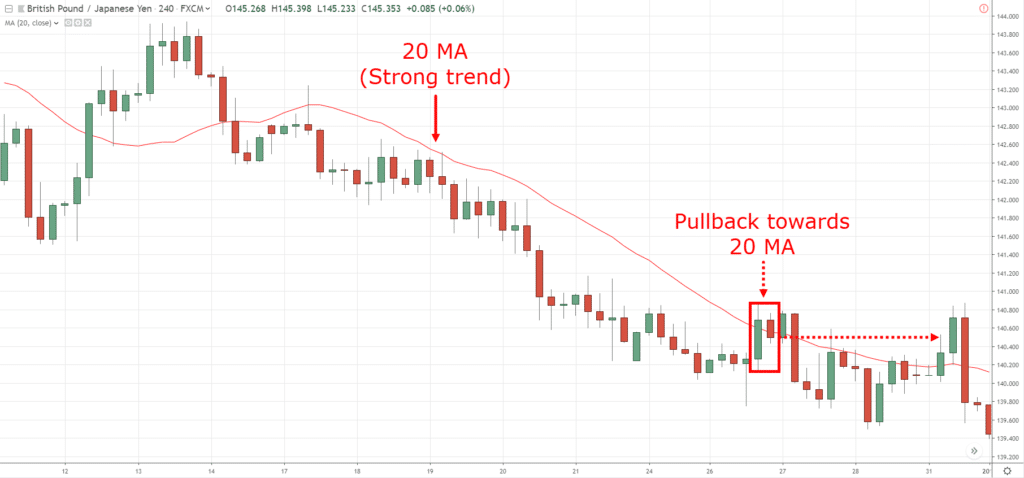
In a strong trending market (when the price is above 20MA), the pullback is shallow.
So, when the price “stalls” after a pullback (in the form of an Inside Bar), you want to enter as soon as the price resumes in the direction of the trend.
Here’s how you do it (for long setups)
- If the market is in a strong trend (above 20MA), then wait for a pullback to occur
- If a pullback occurs, then wait for an Inside Bar to form
- If there’s an Inside Bar, then go long on the break of the highs (of the Inside Bar)
- And vice versa for shorts
Here are a few examples…
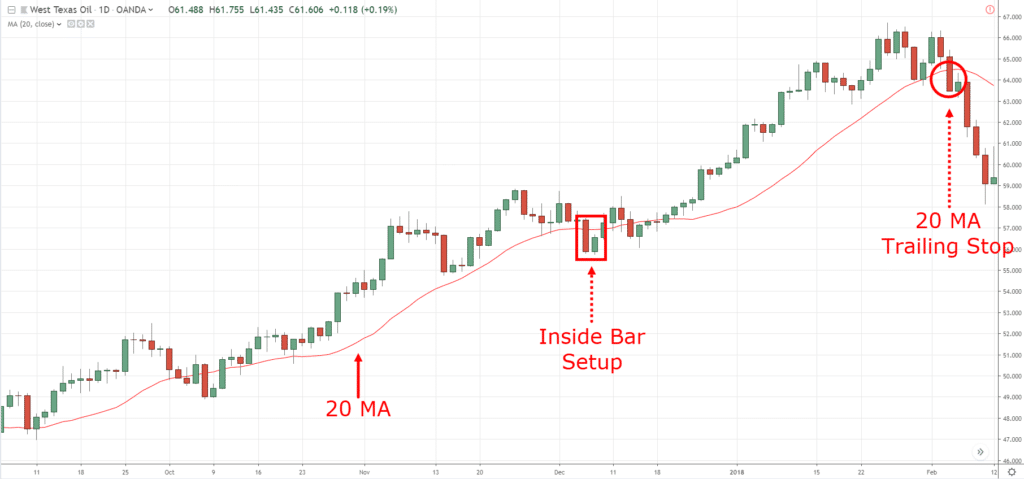
Winning trade on West Texas Oil Daily…
Winning trade on West Texas Oil Daily…
Losing trade on GBP/JPY 4-hour…
Now, don’t worry about how to set your stop loss or trade management because we’ll cover that later.
But for now, I want to share with you a “special” Inside Bar so you can profit from trapped traders.
Continue reading…
The Hikkake Pattern: A variation of the Inside Bar
Imagine:
You identified an Inside bar and you’re feeling bullish.
So, you go long when the price breaks above the highs of the Inside Bar.
But the next thing you know, the market does a 180-degree reversal and collapse lower — and you’re sitting in the red.
This is what we call a Hikkake Pattern (a false breakout pattern).
Here’s how it looks like…
Bearish Hikkake Pattern:
Bullish Hikkake Pattern:
Now…
The Hikkake Pattern can be traded the same way you trade an Inside Bar (catch the reversal or catch the trend).
But, it’s more powerful since breakout traders got caught on the wrong side of the move (and their stop orders would push the market in your favour).
Inside Bar: Entries, stops, and exits
Now, I’ve covered a lot about Inside Bar trading strategies and techniques.
So now the question is, how do you manage your entries, stops and exits?
Let’s find out…
Inside Bar: Entry
You can enter using a stop order when the price breaks out of the Inside Bar.
This is my preferred approach as you’ll enter the trade as the price moves in your favour — but there’s a possibility of a false breakout.
Or, you can wait for the candle to close — but you risk missing a big move.
Clearly, there’s no right or wrong answer to it so you’ve got to find something which suits you best.
Next…
Inside Bar: Stop loss
When it comes to stop loss, you don’t want to set it just beyond the lows of the Inside Bar.
Why?
Because as you’ve learned, a variation of the Inside Bar is The Hikkake Pattern.
This means if you set your stop loss just below the lows of the Inside Bar, you could get stopped out prematurely on a Bullish Hikkake Pattern.
So, a better way to set your stop loss is 1 ATR below the low of the Inside Bar (for long trades) — so your trade has more “breathing room”.
Alternatively, for Catch The Trend, you can consider setting your stop loss 1 ATR away from the 20MA (since the market finds Support at the 20MA).
If you want to learn how you can use the ATR indicator to set your stop loss, then watch this video below…
Inside bar: Exit
Now your exits depend on your goals.
What do you want to accomplish — capture a swing or ride a trend?
Capture a swing
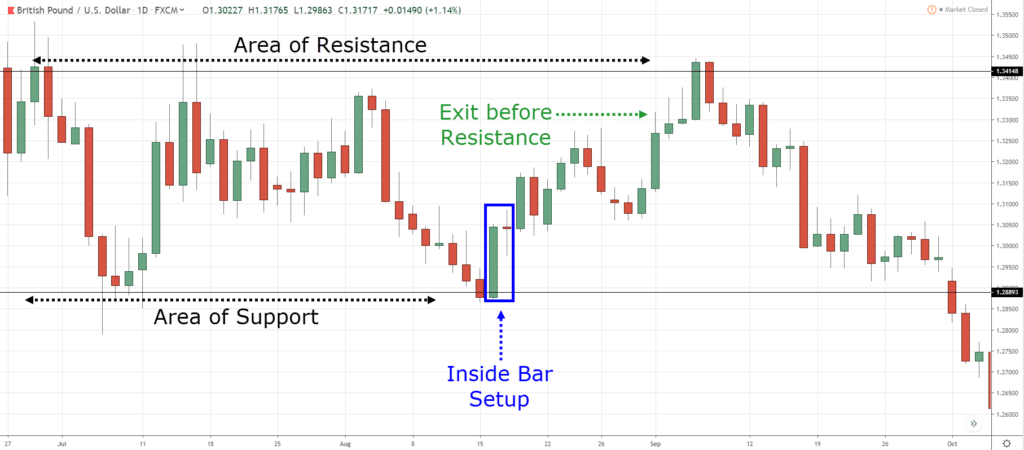
If you want to capture a swing, then you can exit your trades before opposing pressure steps in.
For example:
If you’re long, then you want to exit your trade before Resistance or swing high.
Here’s what I mean…
Ride a trend
And if you want to ride a trend, then you can trail your stop loss as the market moves in your favor.
For example, you can trail your stop loss using the 20MA.
Here’s an example…
Does it make sense?
Awesome!
Bonus: Inside Bar price action analysis
Recall:
Not all Inside Bars are created equal.
Some Inside Bars have a large range and some a small range.
Clearly, if you want to trade the breakout of an Inside Bar, you’d want to go with the small range one.
Here’s why…
1. You have a tighter stop loss
You can reference the low of the Inside Bar to set your stop loss (the smaller the Inside Bar, the smaller your stops).
And with a smaller stop loss, you can put on larger position size and still keep your risk constant.
2. The price could move quickly in your favour
Here’s the thing:
The market moves from a period of low volatility to high volatility (and vice versa).
So, if you trade a small range Inside Bar, it means volatility is low and there’s a good chance it could expand in your favour.
This means you could get a good R multiple on your trade in a short amount of time.
Conclusion
So, here’s what you’ve learned today:
- An Inside Bar (with a small range) shows indecision in the markets
- Not all Inside Bars are created equal. The range and body of an Inside Bar matters.
- Inside Bar can be used to trade reversals or the trend (it depends on the context of the markets)
- The Hikkake Pattern is essentially a false breakout of an Inside Bar — a powerful pattern to profit from trapped traders
- Inside Bars with a small range are better breakout candidates as it offers a more favorable risk to reward
Now it’s your turn…
How do you trade the Inside Bar pattern?
Leave a comment and share your thoughts with me.




Hey Rayner, Excellent article, but can you please remove the two annoying prompts that pop up on every single visit to this website as it is so annoying for those of us that already responded to these. We don’t need to keep seeing these again and again. Thanks.
Hey Nic, thank you for your feedback. I’ll let my developer know about it and see how we can improve. thanks!
Thank you for such nice explanation
You’re welcome!
You are awesome i like your all strategy thanks man please send me more on my email
Will do!
Hey Raynor
Excellent content , since I been looking for these inside bars my returns have been more on the up…I like riding the trend
Awesome to hear that, Johann!
Thank you for taking your precious time to share your valuable insights with us. Good job.
My pleasure, Brian.
Superb Article. Excellent Analysis.
Thanks G!
I still need to repeat the lesson for now I did not understand it well.
Take your time…
As usual, well broken down. You are the best. Thank you very much. keep the good work.
You’re welcome, CHY.
Hi Rayner, you have taught me so much. I do not know how to repay you for sharing your knowledge and also caring for people.
Knowledge is power and you are empowering us everyday. May God Bless you Rayner.
I’m glad to be of help!
Hello Rayner,
Do you have a youtube video on this?
This is the closest I have… https://www.youtube.com/watch?v=N23YyEm9Mf4
Pleasure to read your blog posts. Highly informative and transparent. One suggestion : Your posts may be re-arranged under several heads in the order of basic to advanced level so that any one can go thr’ it in an orderly manner. Thanks
Thank you for your feedback, I’ll look into it. cheers
Thank you so much sir.
Cheers
Thank you yet again Rayner. I have been wondering how best to trade inside bars, and you have explained it so well.
Thanks again
My pleasure, Michael.
Thank u for this presise exeplanation with simple examples. God bless you.
You’re welcome!
awesome work
Cheers
What time frame would you suggest for intraday Trading of the inside candles ?
1 min 3 min ? longer time frame could make us miss the move right?
I can´t find the link to download the ebook! A little help, please!
thanks rayner
Cheers
I’m glad to meet you rayner. your videos help me a lot. thank you.
Awesome to hear that!
Hey hey what’s up my friend? Thank you so so much for ur benevolence. Heavens will reward you!
Glad to help out!
Hi Rayner so that means the 2nd candle whatever colour it is say its green that normally means it is a bullish trend right? email answer to unitedclean04@hotmail.com. Tom