You have probably heard about the Moving Average Crossover.
But the question is this…
Does it work?
Is this just another hocus pocus in technical analysis?
That’s what you’ll discover in today’s video (and no, the answer is not what you think).
Ready?
Let’s get started…
The Moving Average Crossover Strategy
We will backtest it using historical data to test whether moving average strategy works in trading.
The strategy should at least beat a buy-and-hold strategy on the S&P 500 to claim it works.
Here are the markets that we are going to trade…
Markets (2000-2018)
- S&P 500
- EURJPY
- US T-Bond
Now, here are the rules of the moving average strategy that we will backtest…
The rules
- Go long when the 50 MA cross above the 200 MA
- Go short when the 50 MA cross below the 200 MA
- 3 ATR trailing stop loss
- 1% risk
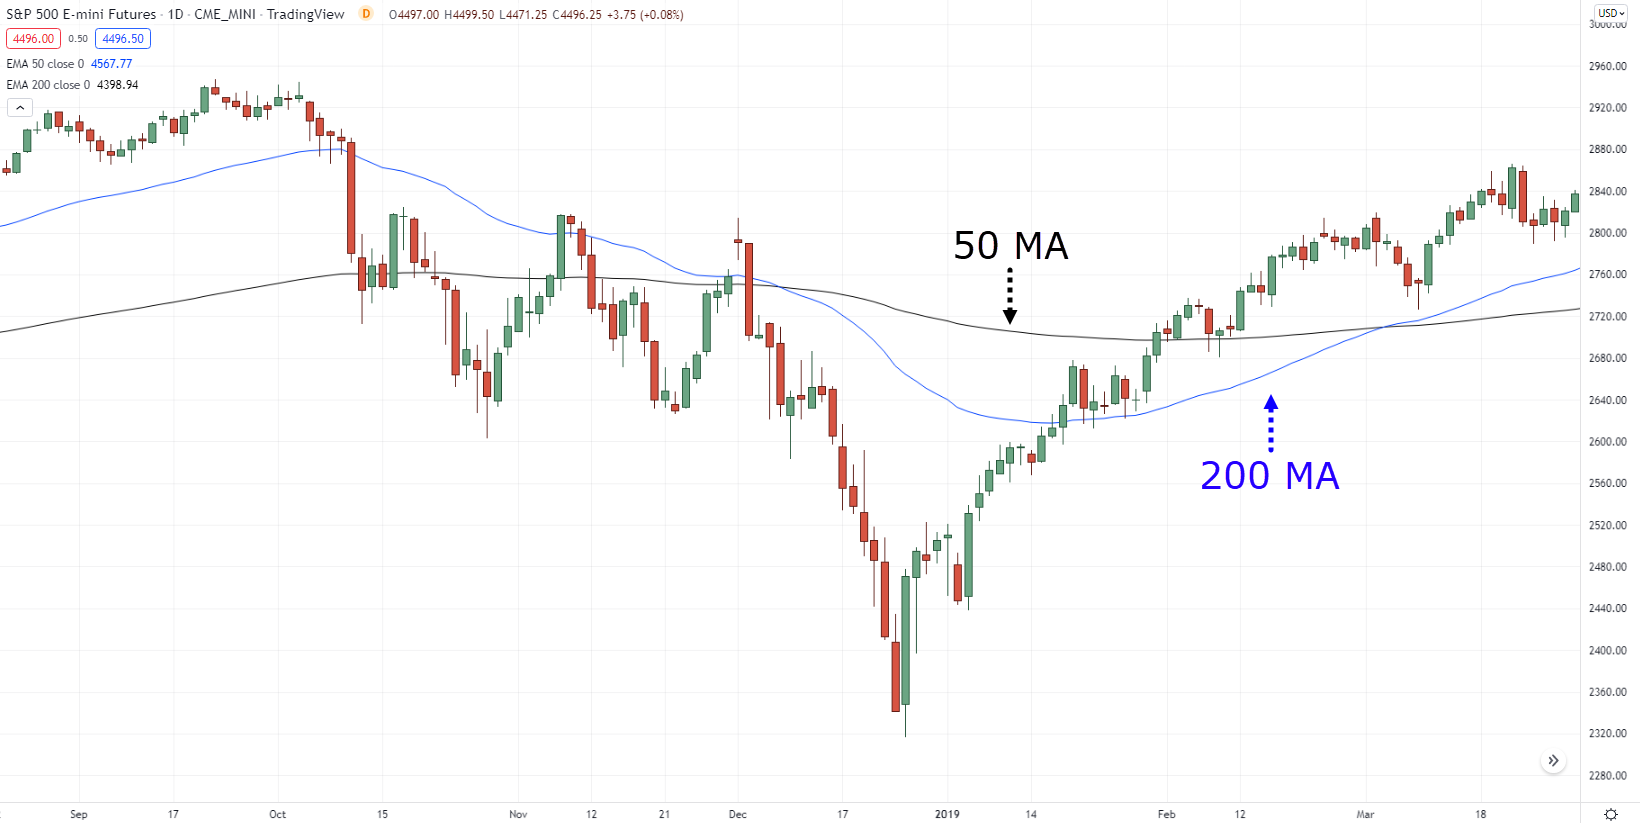
Here’s an example of what this strategy looks like.
The blue line is the 50 MA, and the black line is 200 MA on the S&P 500 daily timeframe:
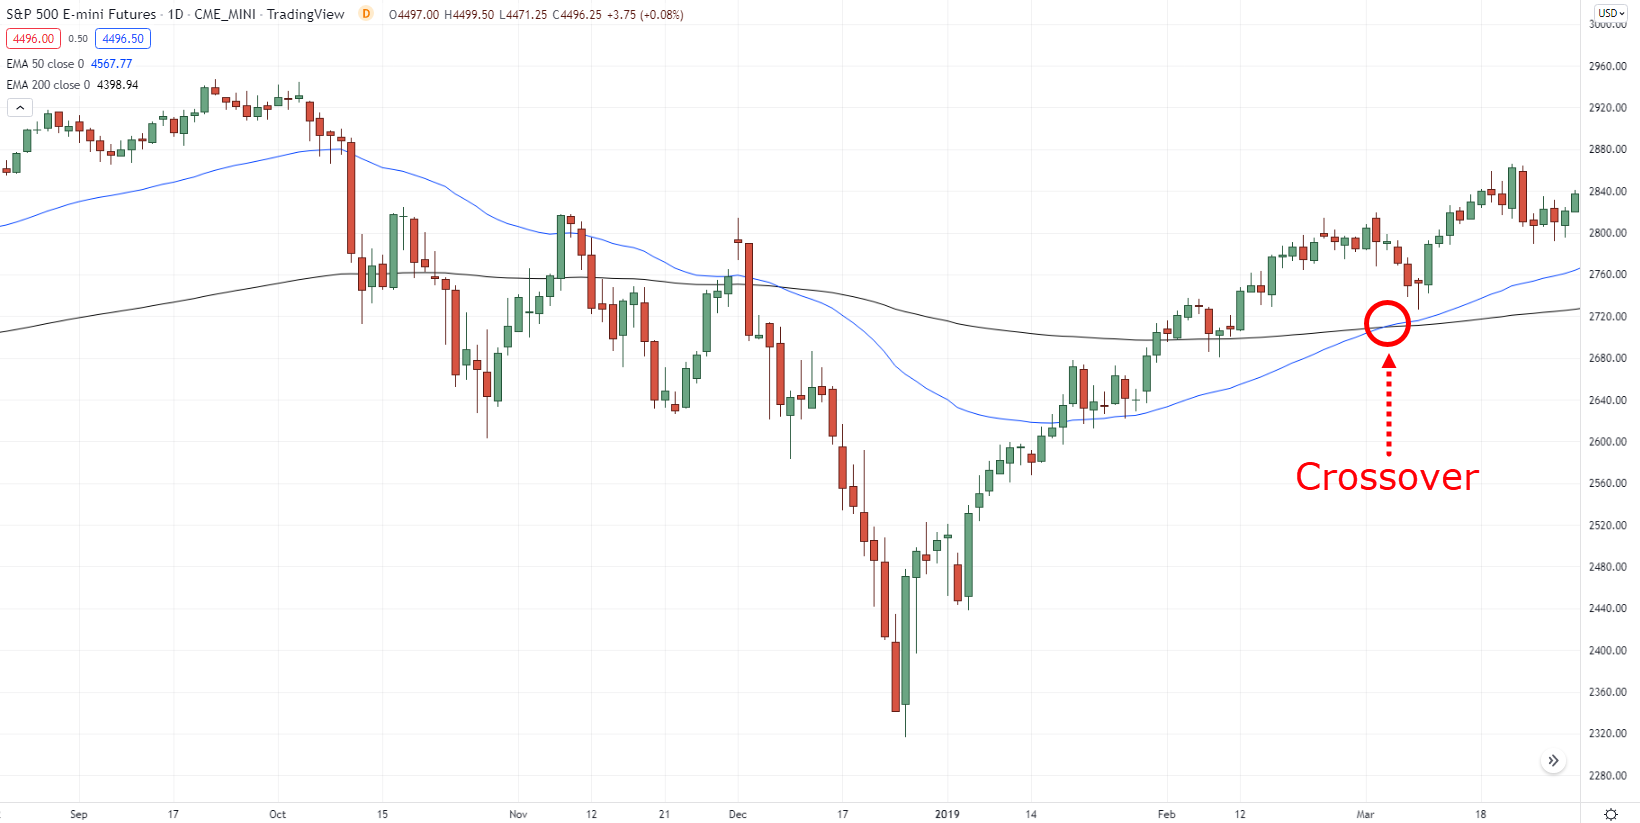
This is where the 50 MA crosses above the 200 MA:
That is your buy signal.
Then, your trailing stop loss is 3 ATR.
Wait…
What is 3 ATR, you may be asking?
It’s straightforward so let me explain.
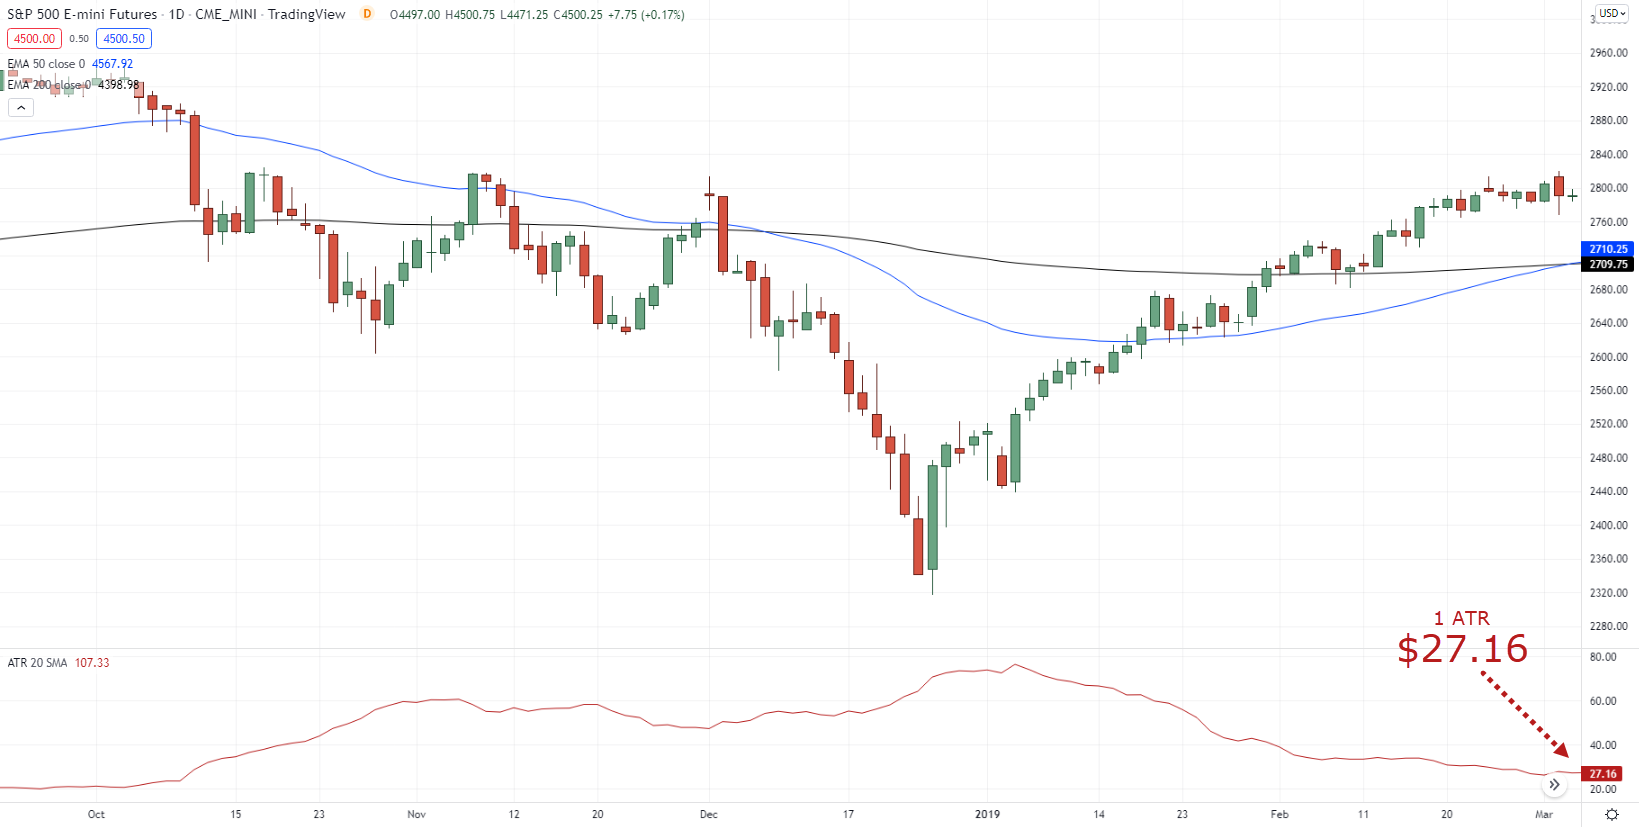
Once you pull out your ATR indicator and find out the value…
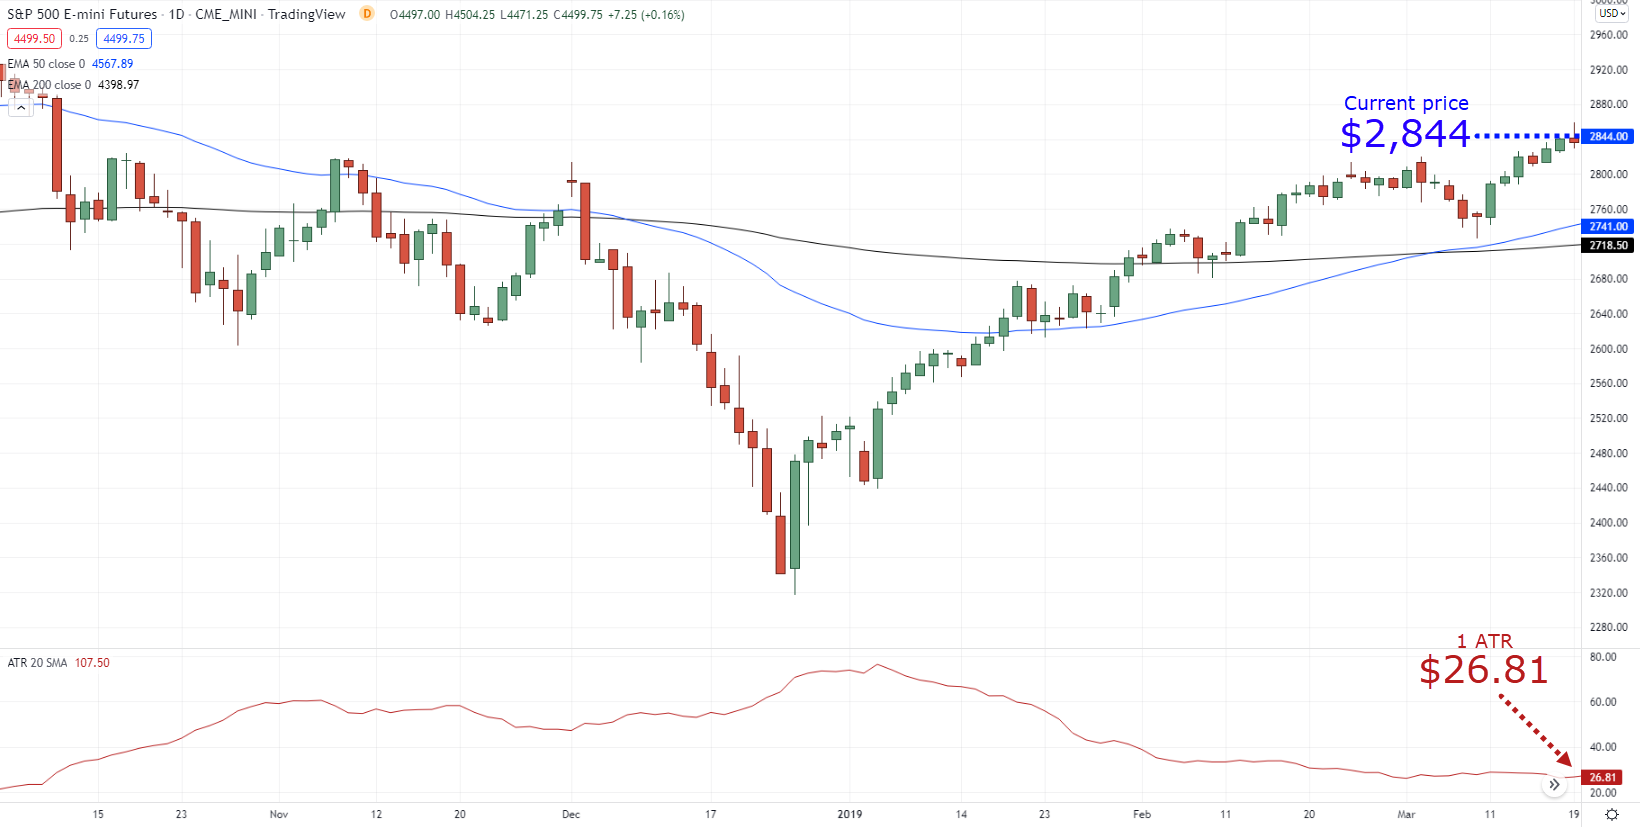
You will see that the current ATR value is $27.16 on the S&P 500 daily timeframe as the crossover occurs:
Now, multiply the current ATR value three times (3 ATR), and you get $81.48.
Next…
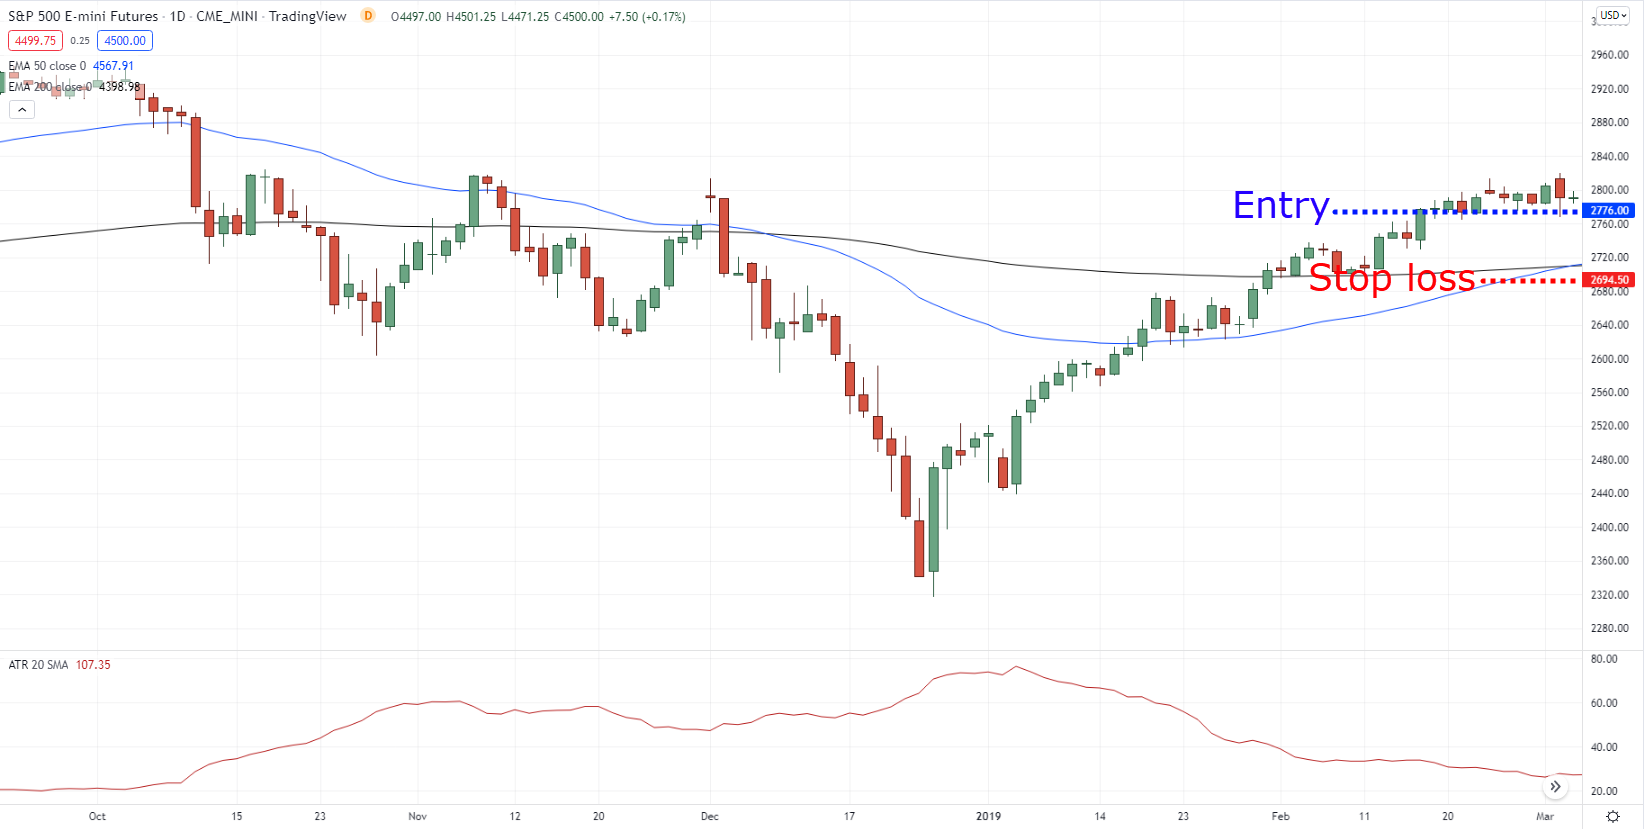
Let’s say you got an entry price of $2,776.
Subtract your entry price of $2,776 with your 3 ATR of $81.48, and you get: $2,694.52
So, what this means now is that your entry price is $2,776 while your initial stop loss is $2,694.52:
Simple, right?
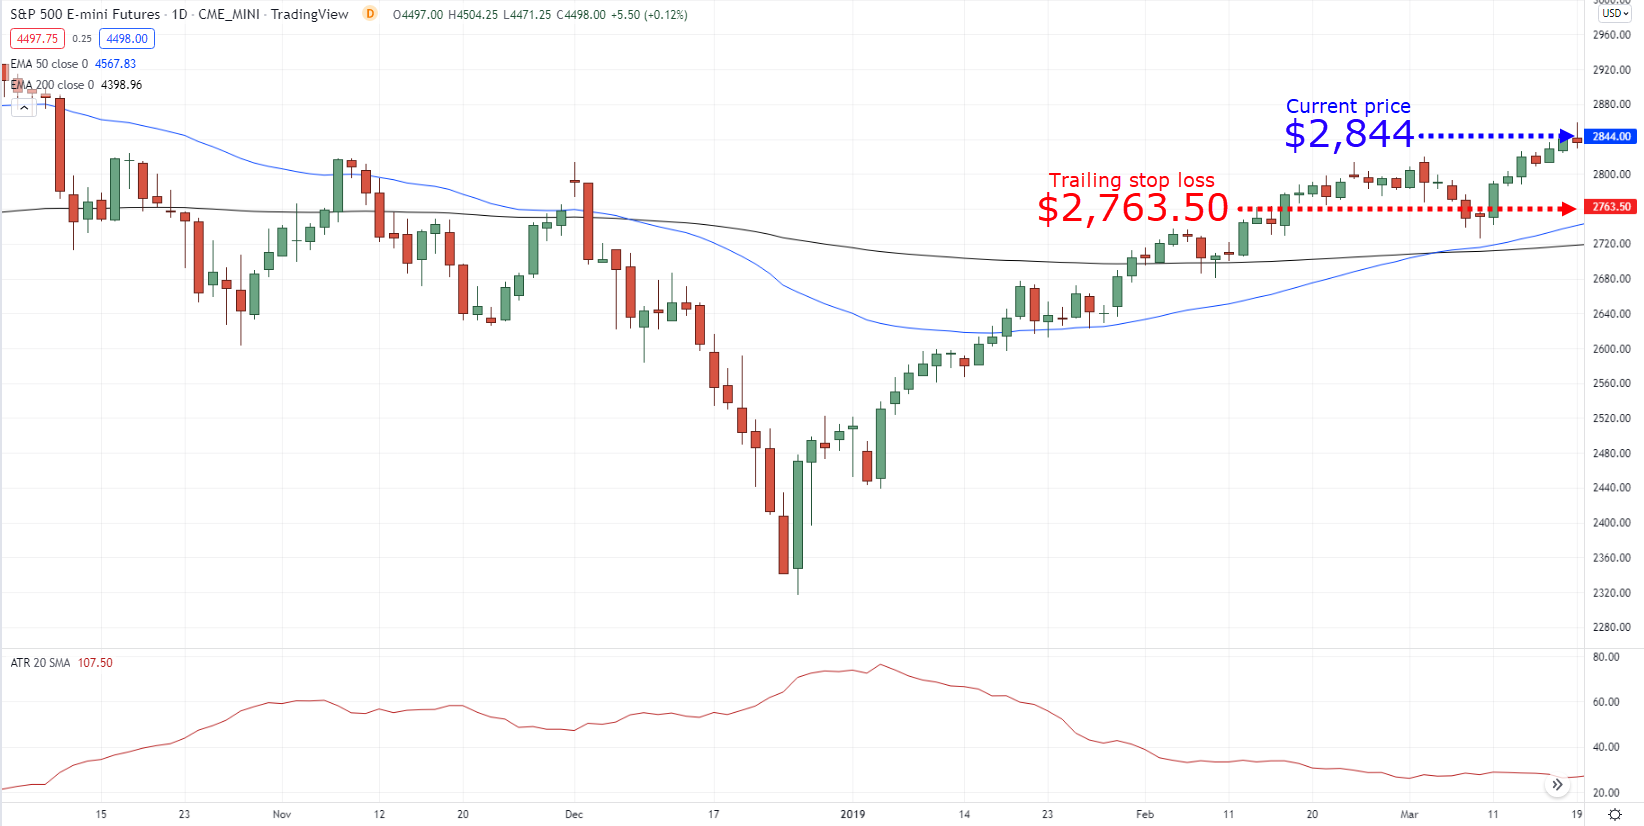
Now let’s say the market moved in your favor, and the current price now is $2,844, with the ATR value currently sitting at $26.81:
Again, we multiply the current ATR value of $26.81 by three then subtract it with the current price of $2,844 to get our recent trailing stop loss which is $2,763.57:
If the current price suddenly comes down and closes below the trailing stop loss line, that means our trailing stop loss is hit.
This is what I mean by using a 3 ATR trailing stop loss.
At the same time, as the market moves in your favor, calculate what 3 ATR is and subtract it from the current price
Simple enough?
Good.
Now, what about the results?
The results (3 markets)
- Number of trades: 534
- Winning rate: 43.26%
- Annual return: 1.31%
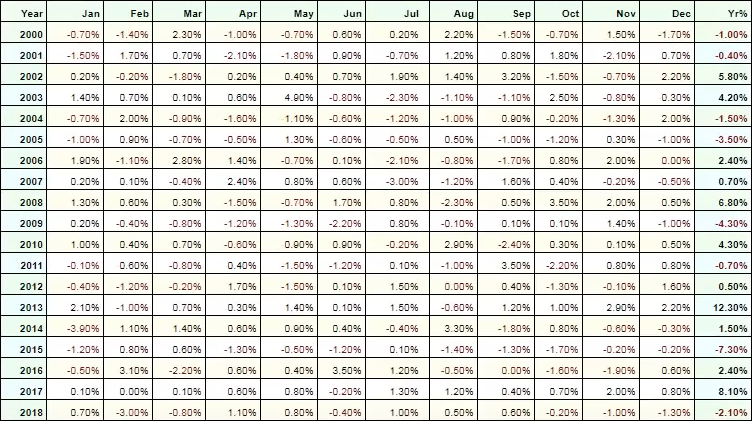
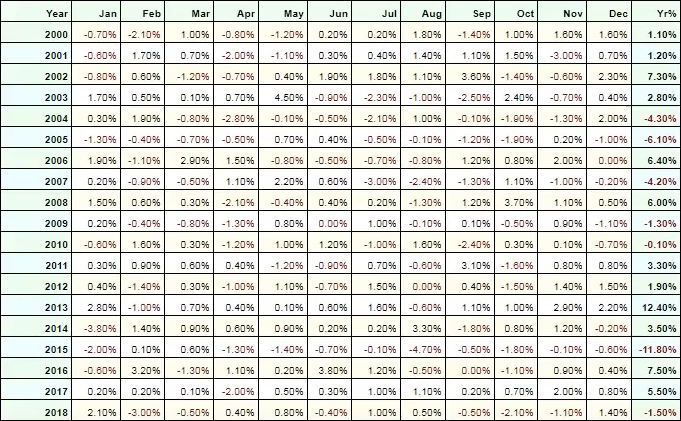
And this is the breakdown of the results…
Let’s be honest…
It’s a losing trading strategy.
What’s the reason?
Let me tell you the first secret as to why this strategy loses money…
Secret #1: Moving Average Crossover Don’t Work Well With Small Number Of Markets
Before we conclude that this trading strategy doesn’t work, I want to ask you a question…
How does a moving average crossover make money?
It’s not a trick question.
I’m sure you can agree that it makes money when there’s a trend.
Now, how does it lose money? If the strategy is used in a ranging market!
Your results aren’t going anywhere when the market chops up and down.
So now…
How can we improve on this?
Maybe, if we trade more markets, we could ride more trends.
If we can ride more trends, we might be able to make more money!
Right?
So let’s put that thought to the test…
Markets (2000-2018)
Instead of the three markets that we traded earlier, we’ll now trade 20 markets:
- Gold, Copper, Silver, Palladium, Platinum
- S&P 500, EURJPY, EURUSD, USDMXN, GBPUSD
- US T-Bond, Euro Bobl, Euro Buxl, Euro BTP, 10-Year Canadian Bond
- Heating Oil, Wheat, Corn, Lumber, Sugar
The rules this time are still the same.
The Rules
- Go long when the 50 MA crosses above the 200MA
- Go short when the 50 MA crosses below the 200 MA
- 3 ATR trailing stop loss
- 1% risk
Next…
The results (20 markets)
- Number of trades: 3,537
- Winning rate: 41.53%
- Annual return: 14.30%
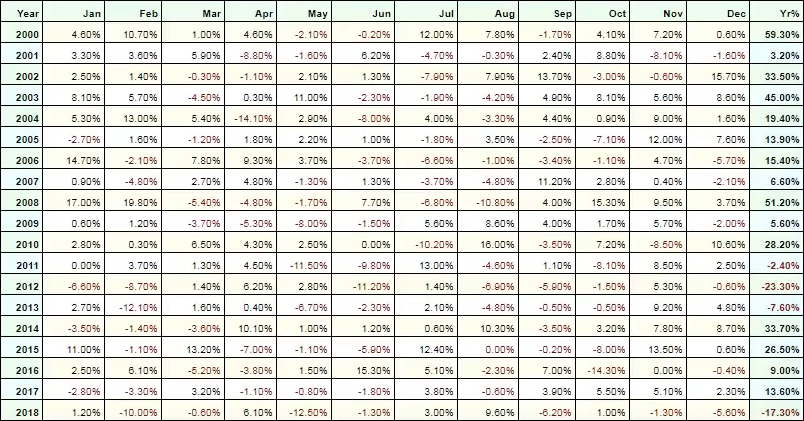
Here’s the breakdown of the results over the last 18 years:
Wow!
That’s so much better than the previous test.
So, what happened?
Did we change anything in our entry and exit rules?
Nope.
All we did was trade more markets.
This leads me to my second secret…
Secret #2: Moving Average Crossover Works Best When You Trade Many Different Markets
It’s simple.
A moving average crossover works best during trending periods, so you trade more markets to capture more trends, which will make you more money.
Tada!
Now before I move on…
Many traders make a big mistake because they focus a lot on the parameter.
For example, if the 50 MA and 200 MA don’t work…
They’ll change the 50 MA to 35 and change the 200 MA to 189 MA.
Here’s the thing…
If you keep adjusting the parameters to make the strategy work, what you’re doing is what we call “curve fitting.”
It’s like trying to memorize the question and answers from last year’s examination papers!
But what happens when you take that same exam this year?
Would the answers that you memorized help you?
Unlikely.
Why?
Because you can be damn sure that the questions on that exam this year are different!
So, you see, when the questions change a little, you don’t know how to answer them.
It’s the same for curve fitting in trading.
Makes sense?
But alright.
Let’s say you don’t memorize the answer from last year’s exam paper.
Instead, you try to understand the concept behind those questions.
So when you take the exam paper this year, no matter how much they twist and turn the question, if you understand the concept…
You can be damn sure that you’ll be able to answer it.
This leads me to my next secret.
Secret #3: Focus on The Concept, Not the Parameters
When your trading strategy is not working, stop fine-tuning the parameters; focus on the concept.
Let me prove this to you right now.
Instead of going with the 50 MA and 200 MA, let’s say we go with the 17MA and 189 MA.
The Rules
- Go long when the 17 MA crosses above the 189 MA
- Go short when the 17 MA crosses below the 189 MA
- 3 ATR trailing stop loss
- 1% risk
The markets we’ll trade are still the same.
Markets (2000-2018)
- Gold, Copper, Silver, Palladium, Platinum
- S&P 500, EURJPY, EURUSD, USDMXN, GBPUSD
- US T-Bond, Euro Bobl, Euro Buxl, Euro BTP, 10-Year Canadian Bond
- Heating Oil, Wheat, Corn, Lumber, Sugar
Finally, the results.
The results (20 markets)
- Number of trades: 3,801
- Winning rate: 39.46%
- Annual return: 12.91%
Now…
You can change the parameters to any way you like.
But if you got the concept right, chances are your trading strategy will still make money.
But if you get the concept wrong, then you know it’s tough luck
Again, we use the same parameters using the 17 MA and 189 MA, but we trade three markets this time.
What do the results look like?
The results (3 markets)
- Number of trades: 580
- Winning rate: 40.00%
- Annual return: 1.33%%
Can you see the point that I’m trying to bring across?
With that said…
Let’s do a quick recap, shall we?
Conclusion
- Moving Average Crossover doesn’t work when you trade a few markets
- Moving Average Crossover works best when you trade many different markets
- Focus on the concept, not the parameters
That’s pretty much it!
Now here’s what I want to know…
Are you currently using a moving average cross-over strategy right now?
If so, what improvements you’ll make to your strategy after reading this training guide?
Let me know your thoughts in the comments below!


I have known where to place and adjust my stop losses.
But me I always use 10 MA and 20MA with the same concept. It works in a trending market
That’s great, Topaco!
is this still in profitable…
Hi, Gokul!
Yes, it is! Just don’t forget to back test it on a demo while training your eyes.
Cheers!
Surly the most important thing is to decide what a trend is, then enter as soon as it is established. l prefer your method of using 20, 50 or 200 MA according to the slope of the trend or using any MA that is respected by Price.
My working definition for a trend is two retracements then respecting an MA e.g. 9MA or 50MA, they come in all shapes and sizes – and time frames of course. I would appreciate your comments.
You are the only one who openeup my maid I give you 1000%
Thanks for that, Martin!
Which time frame 200 and 50 ma working? U say stop loss 3 atr then what risk of reward my portfolio is small if stop loss hit my huge money gone
Which Timeframe will be best for this strategy and when is it best to take profit?
Hi, Okolai!
Jarin here from TradingwithRayner Support Team.
You must choose a time frame that suits your personality and schedule.
If you’re someone who holds a day job, trading the 4-hour and daily charts would be suitable.
You can refer to the link below on 5 Things To Look For Before You Exit A Trade:
https://www.tradingwithrayner.com/5-things-to-look-for-before-you-exit-a-trade/
Hope that helps!
If you use MA crossover combined with support and resistance, trendlines and price action it is a very lucrative strategy. I use the 20 and 50 MA on H1 and always trade with the trend.
I recently started using a 21 smoothed MA along with the 200 EMA, and it has been lovely. I was never a fan of MA’s in my earlier days as a trader, but now that I know how to look at them and use them as an extra confirmation instead of trading solely on them, the results have been fantastic in trending markets. I highly recommend them if you need an extra filter for potential trades.
That’s great to hear, Kei!
Glad it helped you.
Cheers!
Good!
Thanks, David!
am using 50 MA & 200 MA on S&P 500 mini
using 3 min TF , not sure whether it work . being doing intraday trading a few month ago. still exploring though ,
Hi, Karl!
You might find the article below informative:
https://www.tradingwithrayner.com/moving-average-indicator-strategy/
Cheers!